The power of compounding is a concept I came across while in my final year of Undergraduate education.
I started to play around with a few numbers to see how compounding works with money.
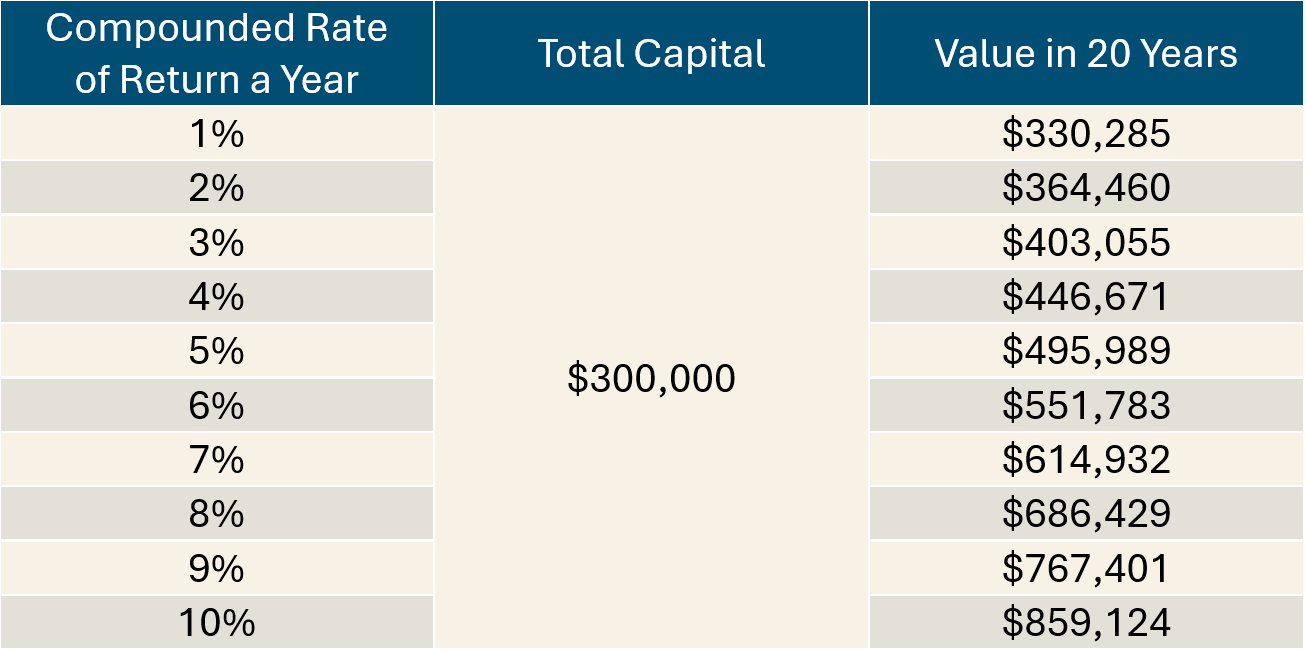
That’s when I discovered that if I were to contribute $15,000/year every year for 20 years, I would have built up a decent sum of $496,000 at 5% a year rate of return.
And $496,000 looks like a rather useful sum of money to do something.
Playing with financial calculators allows me to see what can happen if I choose not to spend money today but rather set them aside to invest for the future.
The table below shows how much a yearly contribution of $15,000 would grow to in 20 years at different rates of return:
This little insight inspired me to kickstart my investment journey.
Particularly, if I could achieve a compounded rate of return of 5% a year consistently, that would already be a pretty satisfying rate of growth for my money.
So, How Can I Earn A Decent 5% A Year Return For The Long Term?
I have also come to learn that the financial markets can be volatile. You can never be sure of the definite amount you will get from the markets.
Coming from an environment where my family did not have much money, I was really risk adverse. Putting money into equity markets felt very much like gambling.
A few years after embarking on my investment journey, I came across a few pivotal pieces of knowledge which propelled me from being a semi-believer to a very strong believer of committing my net worth to the equity markets. They built up the confidence I never had to go “all in” with my money and simply let the equity markets work for me.
A particular piece on the long-term rolling returns of certain equities made the most impact when it was presented to me back then.
In this article, I will explain what is rolling returns and how it has convinced me to commit my net worth to the equity markets.
A Growth Of Wealth Chart Was Not Convincing Enough
You may have seen a similar chart like the chart below:
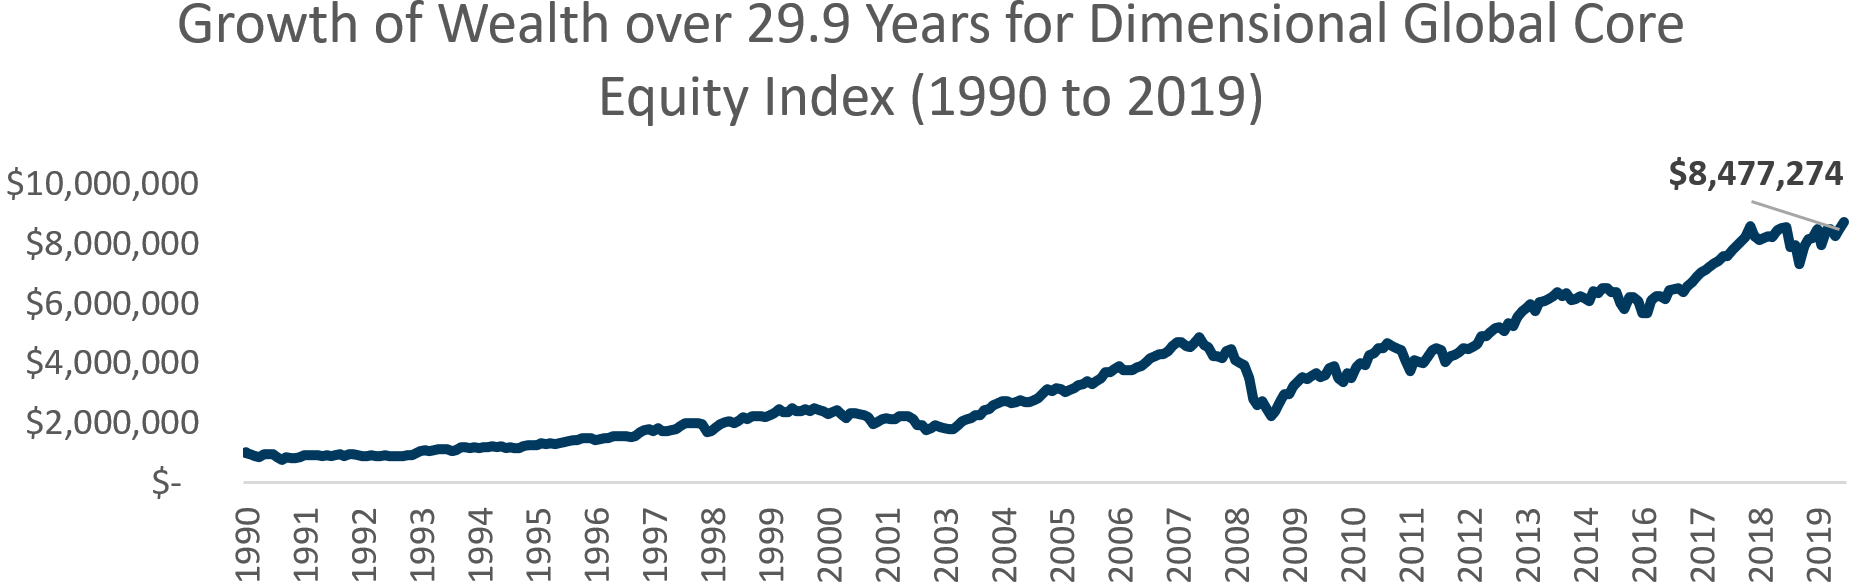
This chart is called the Growth of Wealth chart.
In the Growth of Wealth chart, it shows how $1 million invested in a Dimensional Global Core Equity Index will grow to $8.48 million in 29.9 years. The compounded rate of return is 7.53% a year over this 29.9 years’ period. This factors in a total annual cost of 0.50% to reflect the annual expense ratio and platform fees that clients need to pay.
At Providend, most of our evidenced-based Dimensional portfolios will have this fund called the Dimensional Global Core Equity Fund. The objective of this fund is to maximise the long term total returns by investing in a basket of global stocks.
When you invest in the Global Core Equity Fund, you invest in the equity of 7,876 companies diversified across the world. This fund measures itself against the MSCI World Index (net of div). which is a basket of large-cap, developed market companies. The only difference is that the Global Core Equity Fund is tilted towards companies that are smaller, cheaper and more profitable. These are the dimensions that would likely outperform in the long run.
The earliest Global Core Equity Fund was started in 2008 and thus we have only 11 years of performance data. However, Dimensional has adopted the same formula and re-create an index called the Dimensional Global Core Equity Index to show us how the performance would be like if a Global Core Equity Fund was started in 1990.
The Growth of Wealth chart is beautiful because it shows what kind of returns you will get if you take a long term mentality to investing.
While this chart is beautiful, I remain unconvinced that buying and holding a portfolio of global equities is the way to build wealth in the long run.
The skeptical part of me wonders if there were potentially prolong periods (10,15,20 years) within these 30 years that we might not be able to earn a compounded return of 7.53% a year.
For instance, the 10-year period chart below shows the growth of $1 million from Mar 1999 to Feb 2009.
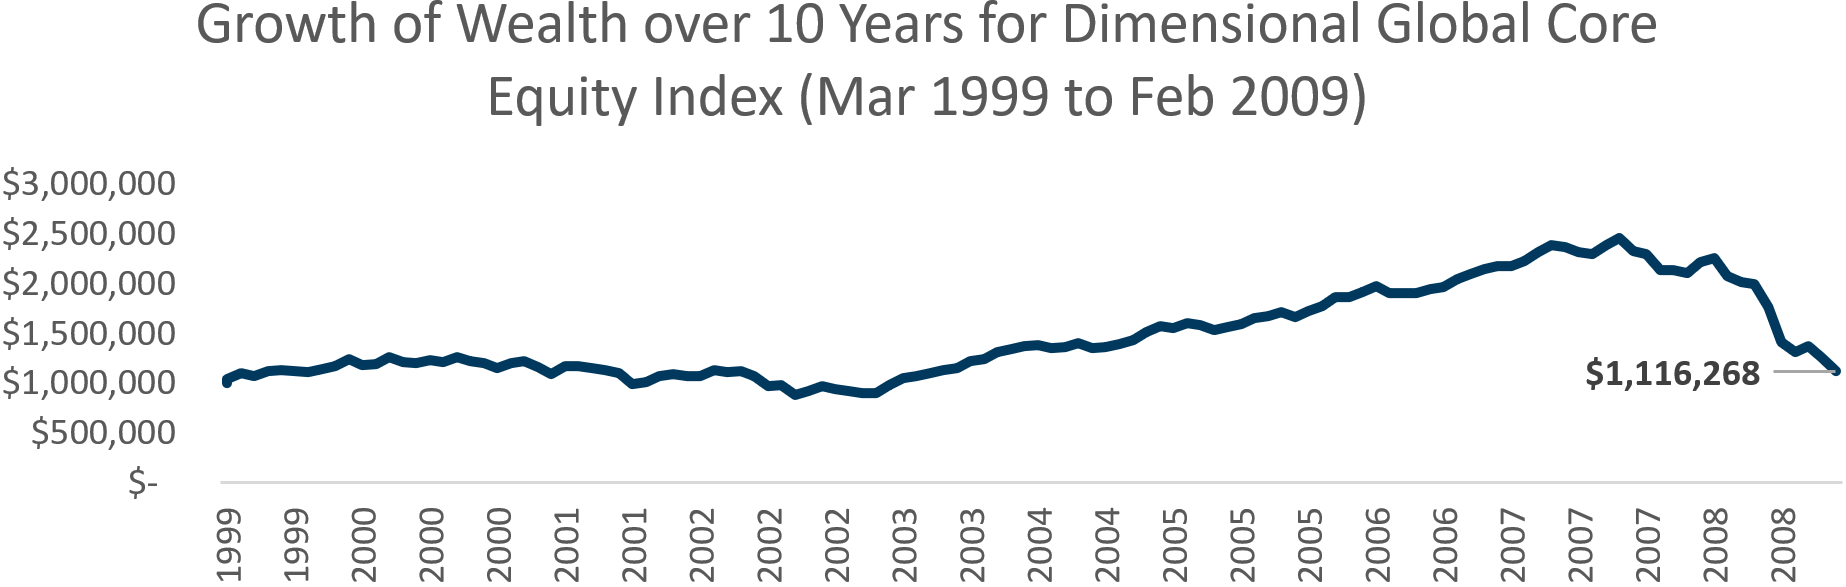
As an investor, if I were to live through this period again, my compounded rate of return would have been 1.1% a year as compared to the 7.53% a year as mentioned previously. That means my $1 million would have only grown to $1.1 million after 10 years.
It seems that if I am lucky, I may earn a compounded return of 10% a year and if I am not very lucky, I may only earn a compounded return of 1% a year. Luck seems to be the determining factor here and it definitely does not instil enough confidence for me to be sure that if I were to invest long term, I would stand a high chance of getting a decent return.
As such, instead of just reviewing one compounded return figure, I started to look at the spectrum of compounded returns across the past 30 years.
The Virtues Of Reviewing Rolling Returns
In the past 30 years, there are a total of:
- 300 5-year periods
- 276 7-year periods
- 240 10-year periods
- 180 15-year periods
- 130 20-year periods
If we take a look at the range of compounded annual returns or cumulative returns in these different periods, we will get a fairly accurate grasp on the range of returns we can expect to receive and determine if we are comfortable with that.
Here is how I will describe rolling returns to you.
If you had the chance to time travel and invest $1 million in the Global Core Equity Index in 5 different 10-year periods in the past, what would each of the returns be?
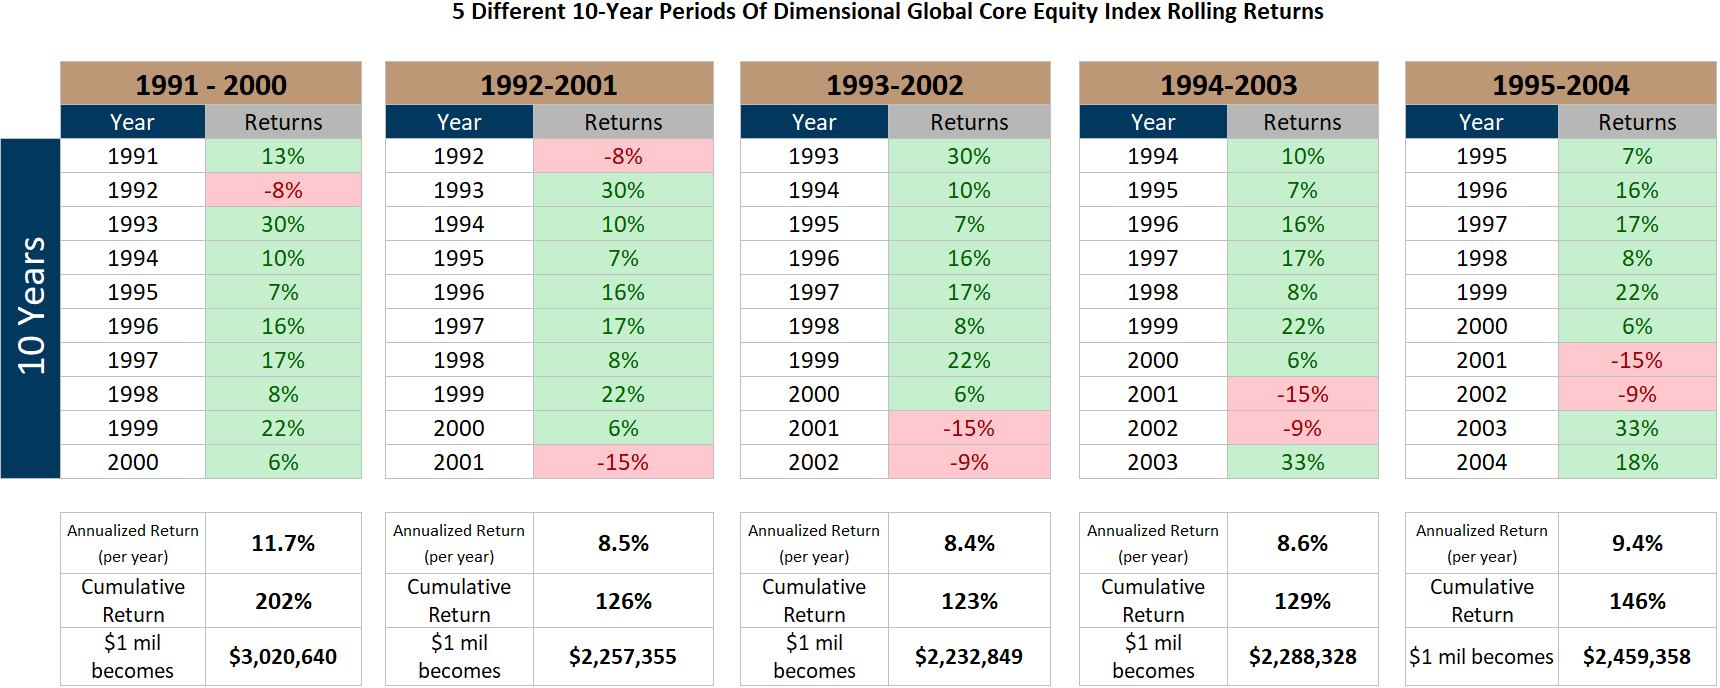
In the table above, I have selectively shown 5 different 10-year periods I could have time travelled back to and the annualized return or the compounded rate of return ranges from 8.4% to 11.7%.
Cumulatively, my money would have grown by either 123% to 202% if I have lived through a 10-year period similar to these 5 in the past. My $1 million would have grown to either $2.23 mil to $3 million.
That is why as a wealth management firm that provides investment advice, we think that you stand a decent chance of building wealth with equities.
What Could The Past 30 Years Of Dimensional Global Core Equity Rolling Returns Tell Us About The Range Of Returns We May Get To Earn?
While we can look at year-on-year rolling returns in the past 30 years, there are 360 months in total.
If we “roll” the Dimensional Global Core Equity’s returns month by month, we would be able to obtain much more rolling periods, which can give us a clearer picture on the spectrum of returns an investor may earn, if they buy and hold a Dimensional Global Core Equity Fund.
1-Year Rolling Returns – Your Returns Are Volatile In The Short Run
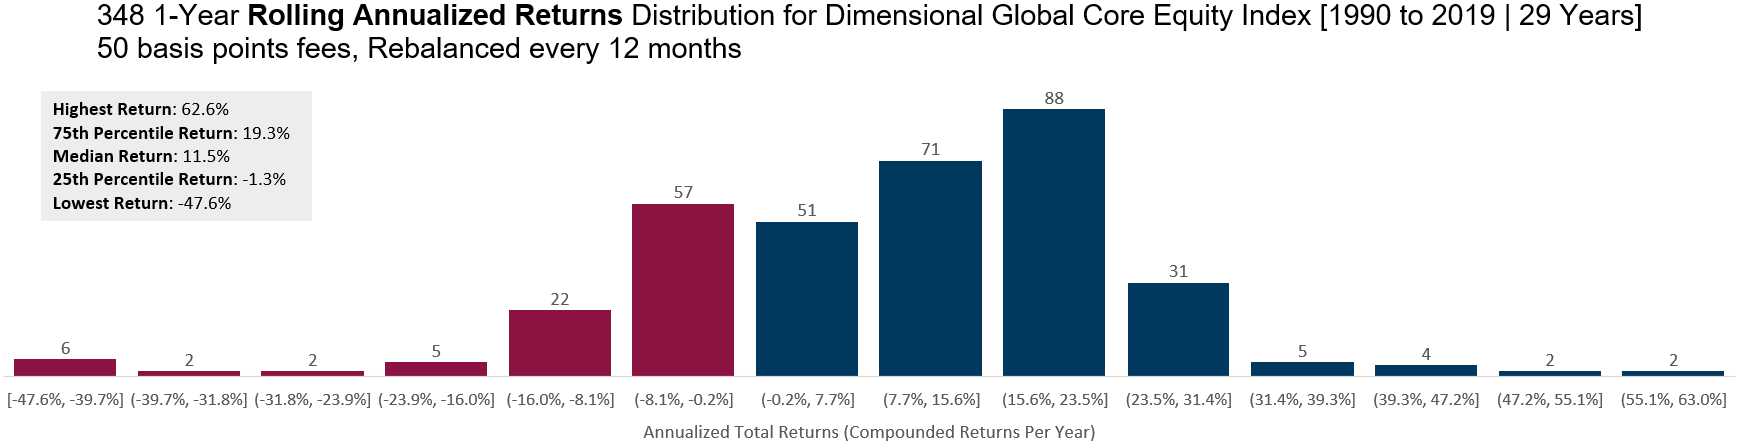
The histogram above shows various 1-year annualized returns ranging from -47.6% to 63%, highlighting the volatility of returns in the short run of 1-year.
Each bar shows a range of returns. For example, there are 88 periods out of 348 periods where the returns range between 15.6% and 23.5%. There are 57 periods out of 348 periods where the returns are between -8.1% and -0.2%.
5-Year Rolling Returns – Greater Chance For Your Returns To Be Positive
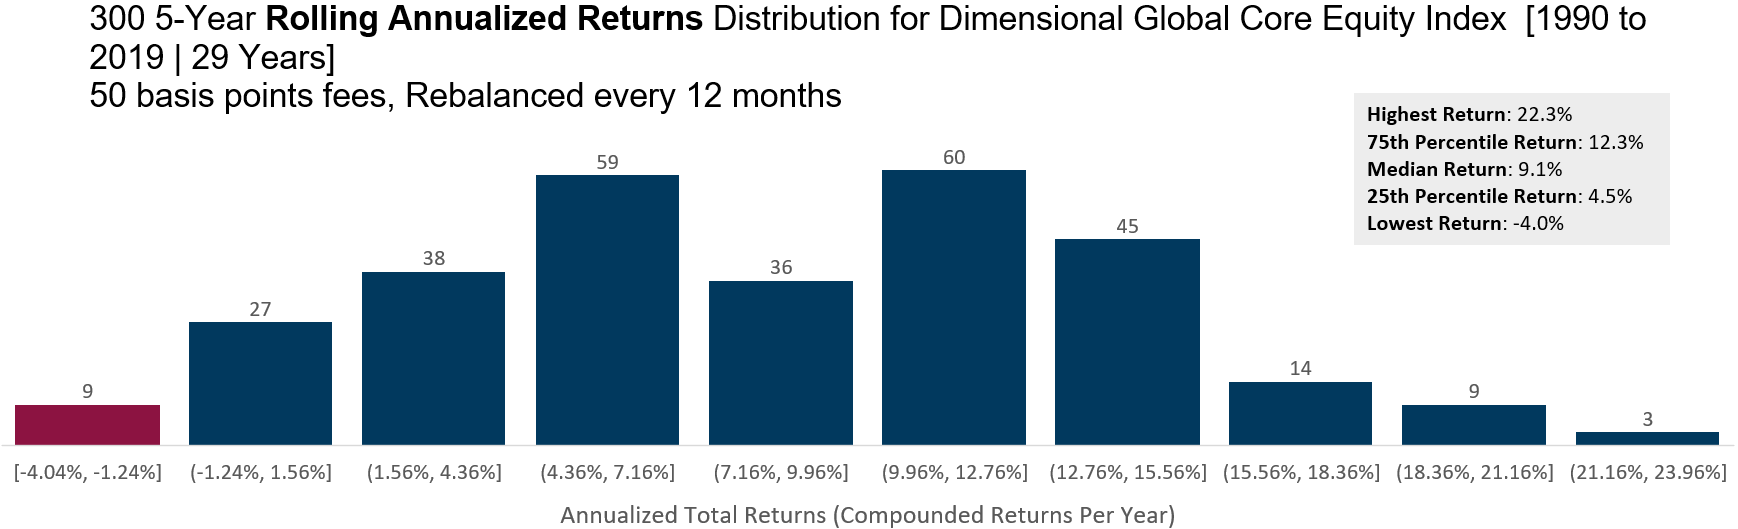
The histogram above shows various 5-year annualized returns ranging from -4.04% to 23.96%, highlighting a greater possibility to achieve positive returns.
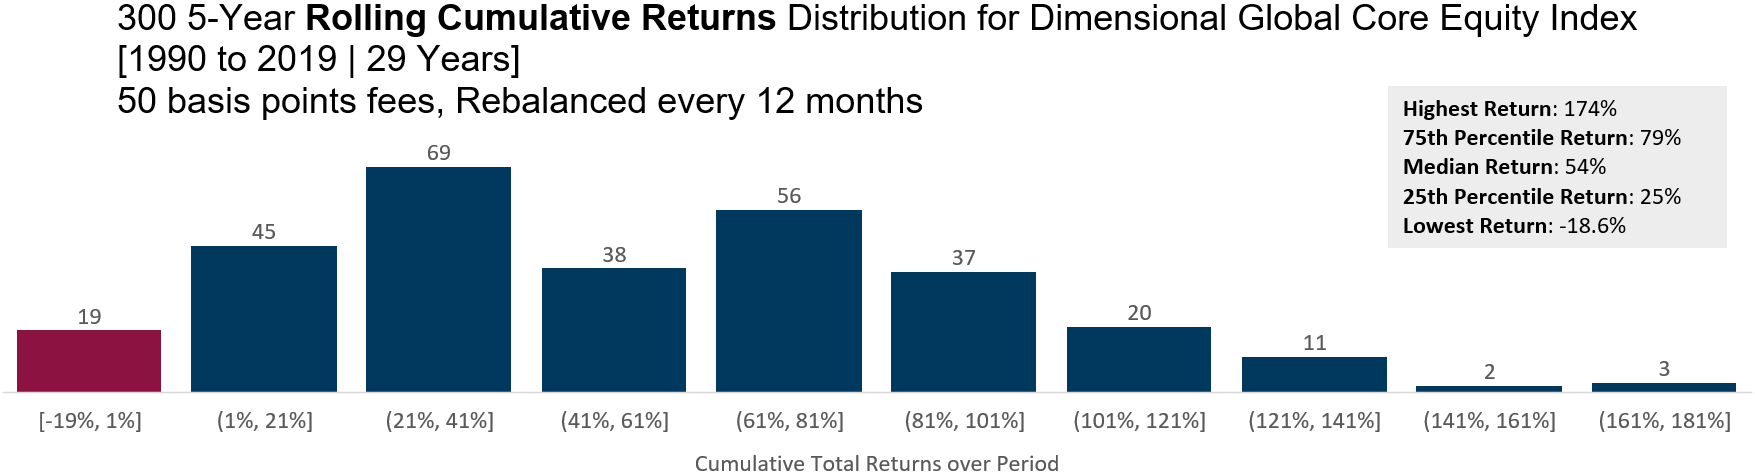
The histogram above shows the same 5-year returns but in cumulative returns. For example, there are 69 5-year periods where the cumulative returns are between 21% and 41%.
One observation is that equities tend to go up more than they go down and the overall range of returns tend to be positive. On average you may earn 9.1% a year or 54% in total over 5 years.
However, in some extreme periods (19 out of 300 periods), 5 years is still not long enough to capture positive market returns.
10-Year Rolling Returns – No Negative 10-Year Periods
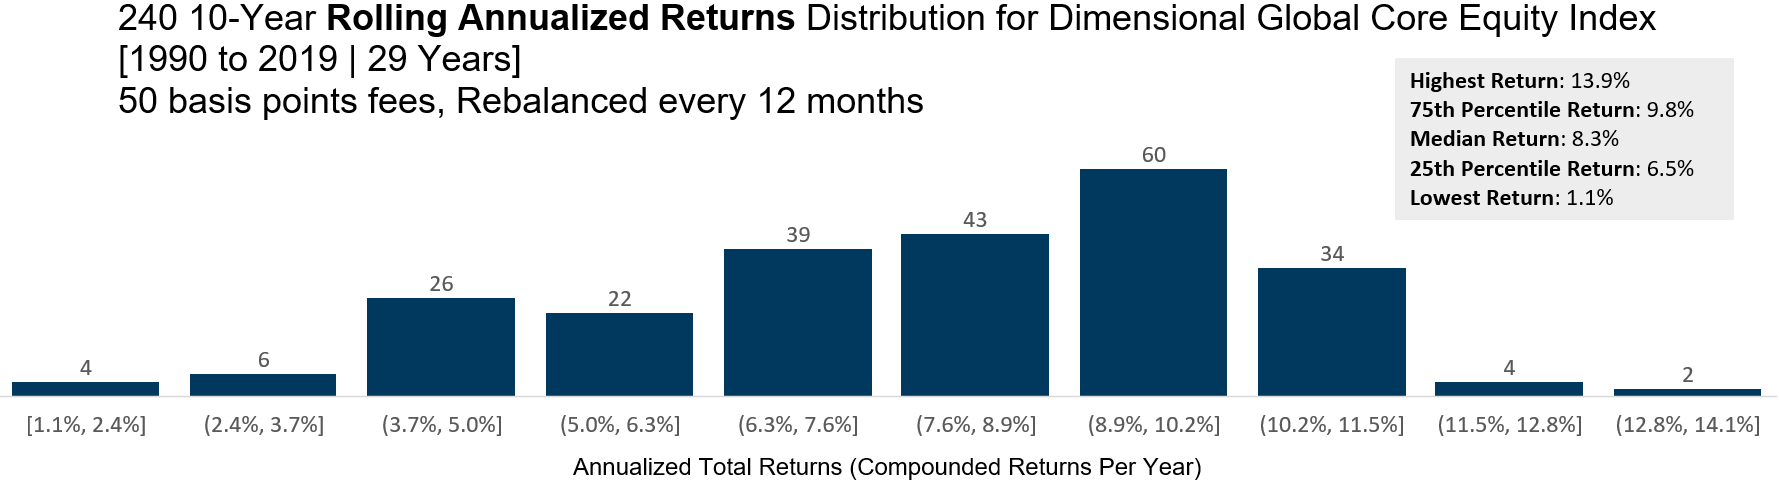
The histogram above shows various 10-year annualized returns ranging from 1.1% to 14.1% which means zero negative periods!
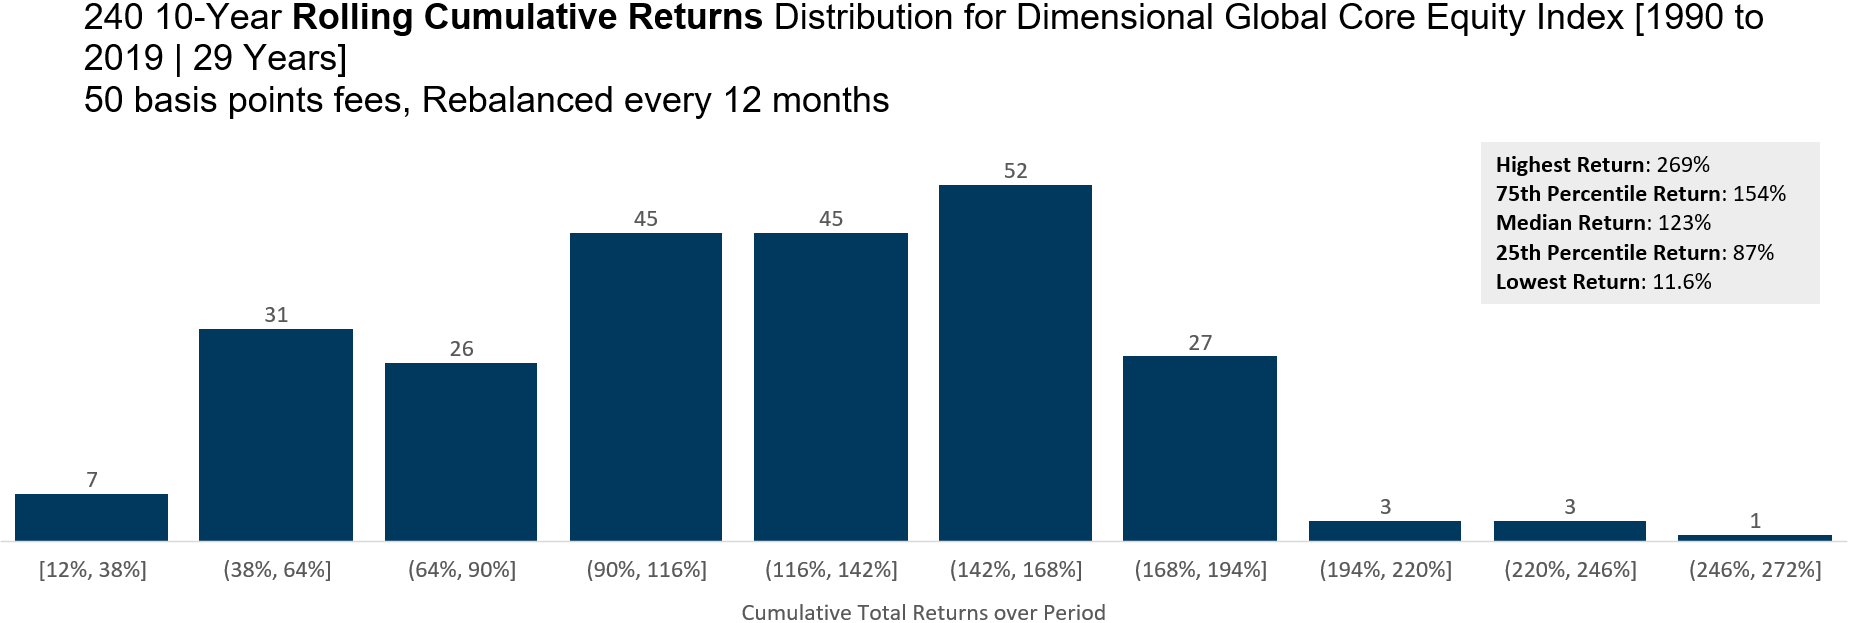
The histogram above shows the same 10-year returns but in cumulative returns.
One observation is that in all the 240 10-year periods, there are no negative periods at all. However, at the extreme end, after a 10-year period, I might not be able to capture a 5% a year compounded return (36 out of 240 periods).
At the 25th percentile, I would earn a compounded return of 6.5% a year or 87% in cumulative returns.
15-Year Rolling Returns – Returns cluster closer to the Median
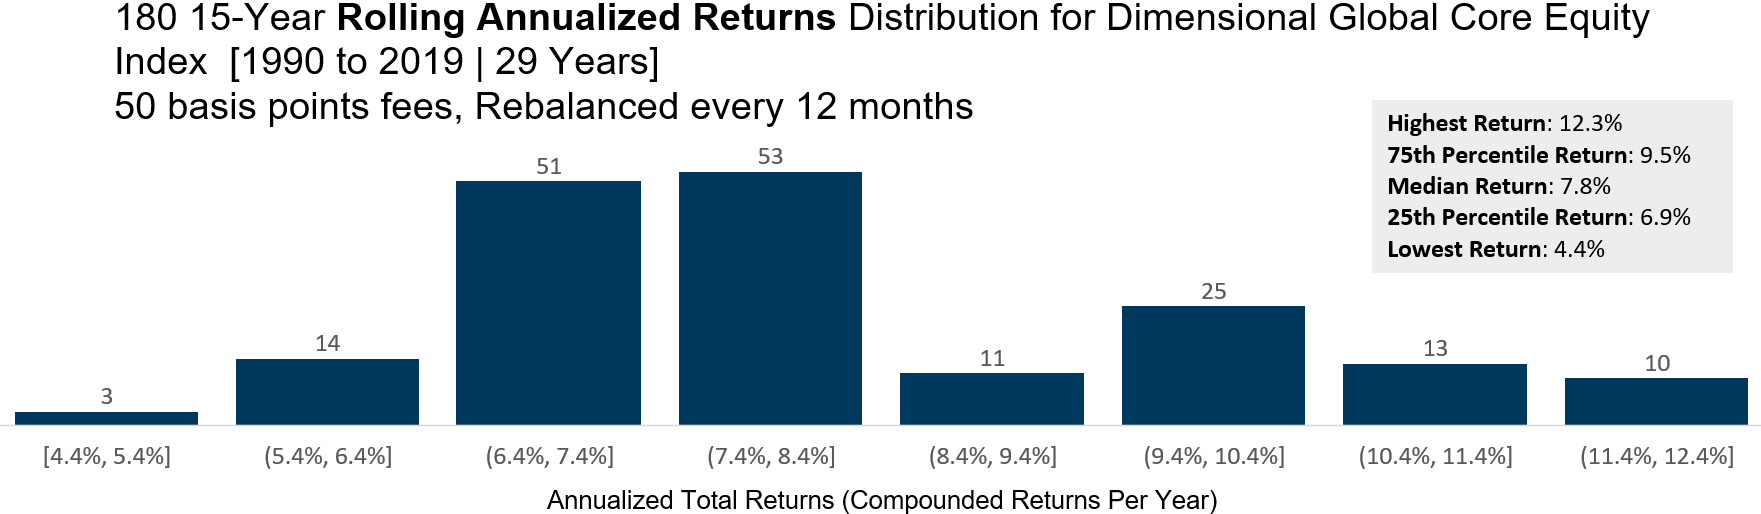
The histogram above shows various 15-year annualized returns ranging from 4.4% to 12.4%.
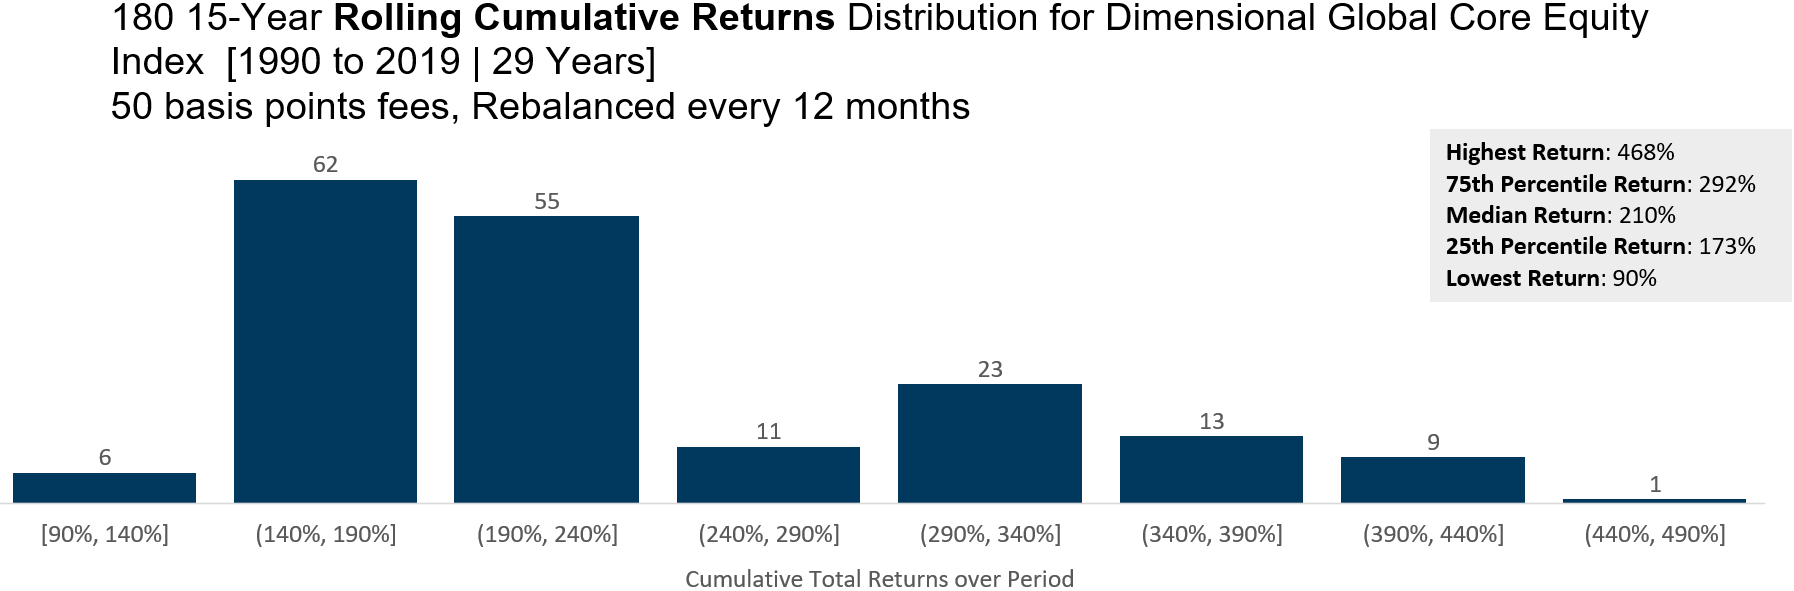
The histogram above shows the same 15-year returns but in cumulative returns.
One observation is that in any of the 180 15-year periods, I stand a very high chance of capturing a 5% return. Most notably, observe that the 25th percentile, 75th percentile and median returns are becoming closer together.
As time passes, the return on your capital tends to cluster closer together (but there is still a difference between earning 173%, 210% and 292%)
20-Year Rolling Returns – Power of Investing Over the Long Term
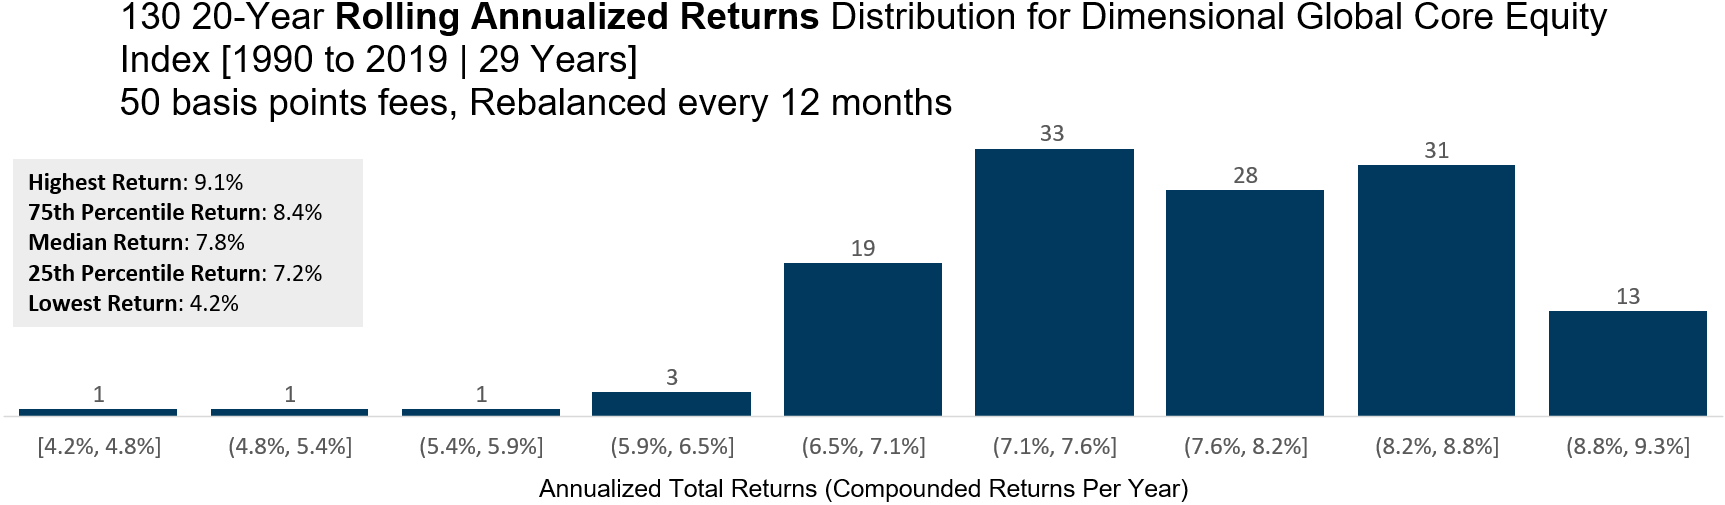
The histogram above shows various 20-year annualized returns ranging from 4.2% to 9.3%.
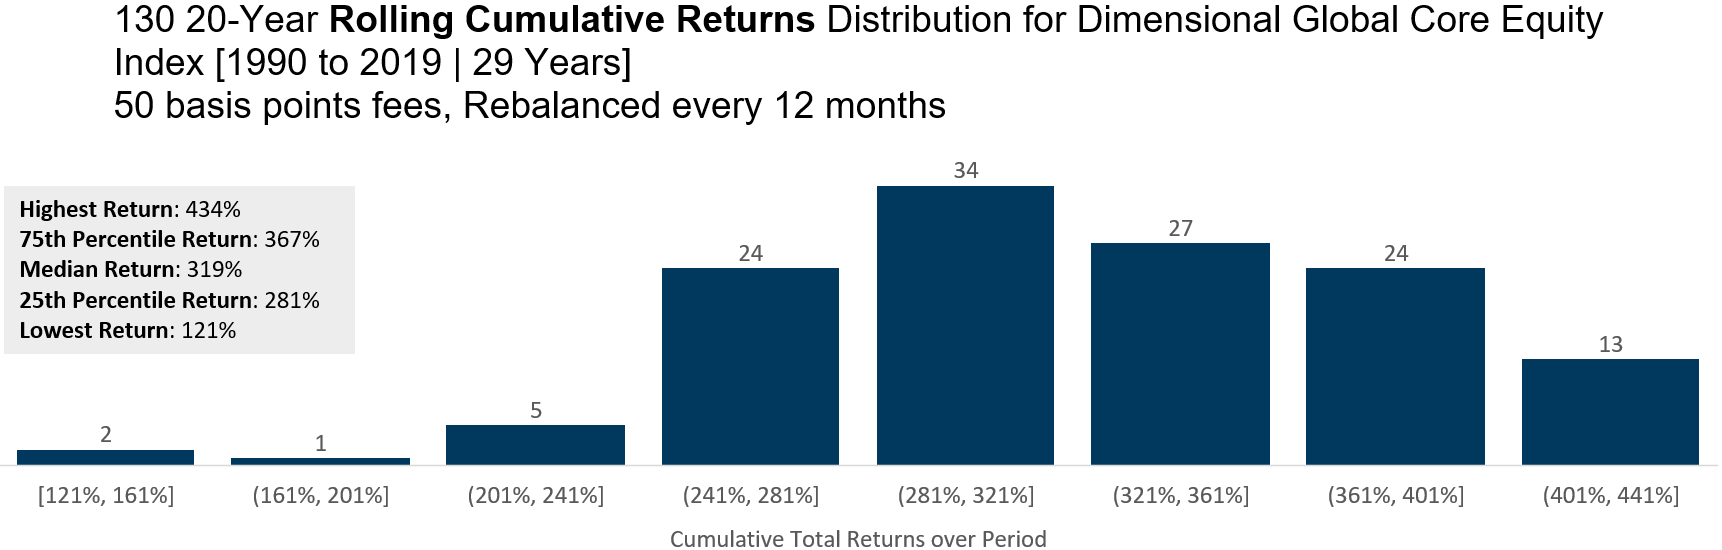
The histogram above shows the same 20-year returns but in cumulative returns.
I shall let the data do the talking.
What We Can Learn From Reviewing The Returns
By now, I think we have all gained a better understanding of the nature of returns if we were to buy and hold a portfolio of global equities.
Here are a few key takeaways:
- The past 30 years have been eventful, filled with many ups and downs.
- In the short term, returns are volatile. There is every possibility for one to earn or to lose a lot.
- Based on history, returns tend to be positively skewed.
- Over time, the volatility of the value of your portfolio is greatly reduced.
- Returns take time to become positive.
- It takes time to capture the required returns.
- The 25th percentile 5-year rolling returns are 4.5% a year. In a lot of cases, we can see decent returns soon
- With the 25th percentile 5-year rolling returns at 4.5% a year, it shows that majority of the returns are more than 4.5% a year.
- There will be challenging periods where it takes a long time to capture the returns.
- There will also be periods where you can capture the returns much earlier than projected.
Studying the rolling returns certainly gave me a better feel of what I am getting myself into. If I am unlucky, it will simply take some time to capture the returns. If I am lucky, returns would be more than decent. If returns are in-between, the returns would also be more than decent.
At the end of the day, nobody doesn’t like surprises. Rolling returns can give us realistic sensing about things which aids in the planning of our own financial independence. For instance, I can use a 5% projected rate of return with reasonable confidence, but I am under no illusion that a 5% return is a given.
As an accumulator of wealth, many of us typically do not invest in lump sums. We are likely to carry out dollar-cost averaging by investing consistently every year. This would mean a diversification across numerous rolling returns expectations with the result approaching the long-term median results which are pretty decent.
That is why, I will take my chances of investing in a low effort, low cost, diversified portfolio.
This is an original article written by Kyith Ng, Senior Solutions Specialist at Providend, Singapore’s first Fee-only Wealth Advisory Firm.
We do not charge a fee at the first consultation meeting. If you would like an honest second opinion on your current investment portfolio, financial and/or retirement plan, make an appointment with us today.