To hedge against high inflation, we should own gold.
However, I think if you are allocated to equity, they would do well in periods of higher inflation as well.
To provide liquidity, smoothed out volatility, and to alleviate the effects of the pandemic, central banks around the world engaged in aggressive monetary policy.
The US Federal Reserve’s balance sheet has increased to $5.25 trillion dollars.
You may hear more and more financial commentators predicting that with so much money injected into the system, there is a possibility that in the future we are going to see very high inflation.
We do not know if very high inflation would eventually show up.
Technically, part of the stimulus is provided to the main street for a very necessary use: To prevent massive unemployment so that if a vaccine is discovered, there will not be a big drop off in productivity.
By purchasing back certain kinds of financial assets with their money, the central banks are providing liquidity to the system, while taking those financial assets out of circulation.
- We do not know whether inflation will rise
- We do not know the magnitude of the rise
- We do not know the duration of the rise (prolong or a spike)
- We do not know when that will happen and when it will end
If your investment strategy entails believing that high inflation will rear its ugly head and that you need to execute upon it, you must get #1 to #4 right.
We do not think that is something that we can do very well.
However, we do think it is a good idea to look at how we can allocate our wealth so that in the event inflation does pick up, your wealth will do well.
One of the asset class that does well in an inflationary environment has been equities. If inflation is gradual, businesses can pass on the cost to consumers. Consumer’s wages may be rising such that they can afford more goods and services.
The stock market tends to do well.
However, if there are persistently high inflation, how would equities do?
Perhaps if we can look at history, we can study how equities did in a period where everyone acknowledges has persistently high inflation.
If we look at history, the 20-year period starting from Feb 1966 to 1986 is one of the most challenging periods.
Economists call this a stagflation period. Inflation is high and economic output stagnate.
Sidetrack a bit: I like to study how someone retiring into different historical 30-year periods to see whether their wealth will last for that duration. Out of the various 30-year periods, the most, most challenging 30-year period that you are likely to run out of money are the 30-year periods that start in 1966 or 1968.
These two periods have a very high inflation rate. Your portfolio did not suffer much negative fall. However, your spending needs to adjust to persistently high inflation. The escalating income need was what cause a retiree to run out of money earlier than 30 years.
Let us get back to the main topic.
How High Was Inflation in the 1960s and 1970s?
We use two indexes to measure inflation. The first one is the consumer price index for all urban consumers. It measures the average change over time in the prices paid by urban consumers for a market basket of consumer goods and services (CPI for short).
The second index is the personal consumption expenditures price index (PCE for short).
The CPI gets more publicity and is used in pension plan adjustments and as references for financial contracts such as Treasury Inflation-Protected Securities (TIPS) and inflation swaps.
The Federal Reserve, however, states its goal for inflation in terms of PCE.
Both calculate price levels based on pricing a basket of goods.
The notable difference is that
- The CPI is based on a survey of what households are buying
- The PCE is based on a survey of what businesses are selling
Another difference is that CPI covers only out-of-pocket expenditures on goods and services purchases. It excludes other expenditures not paid directly. Some examples are medical care paid for by employer-provided insurance, Medicare, Medicaid. These are included in PCE.
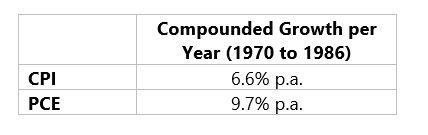
From Feb 1966 to Jun 1986, here is the compounded average growth (CAGR) of the CPI and PCE:
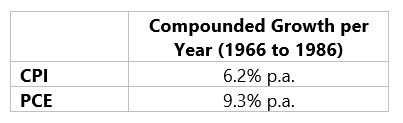
These are very high inflation measurements. For reference, the annualized CPI and PCE for the past 20 years have been 2.12% and 3.3% respectively. In the last 5 years, it has been 0.83% p.a. and -4% p.a.
To give you an idea of the magnitude of 6% and 9% compounded growth, the following charge shows the growth of $1 million over this 20-year period.
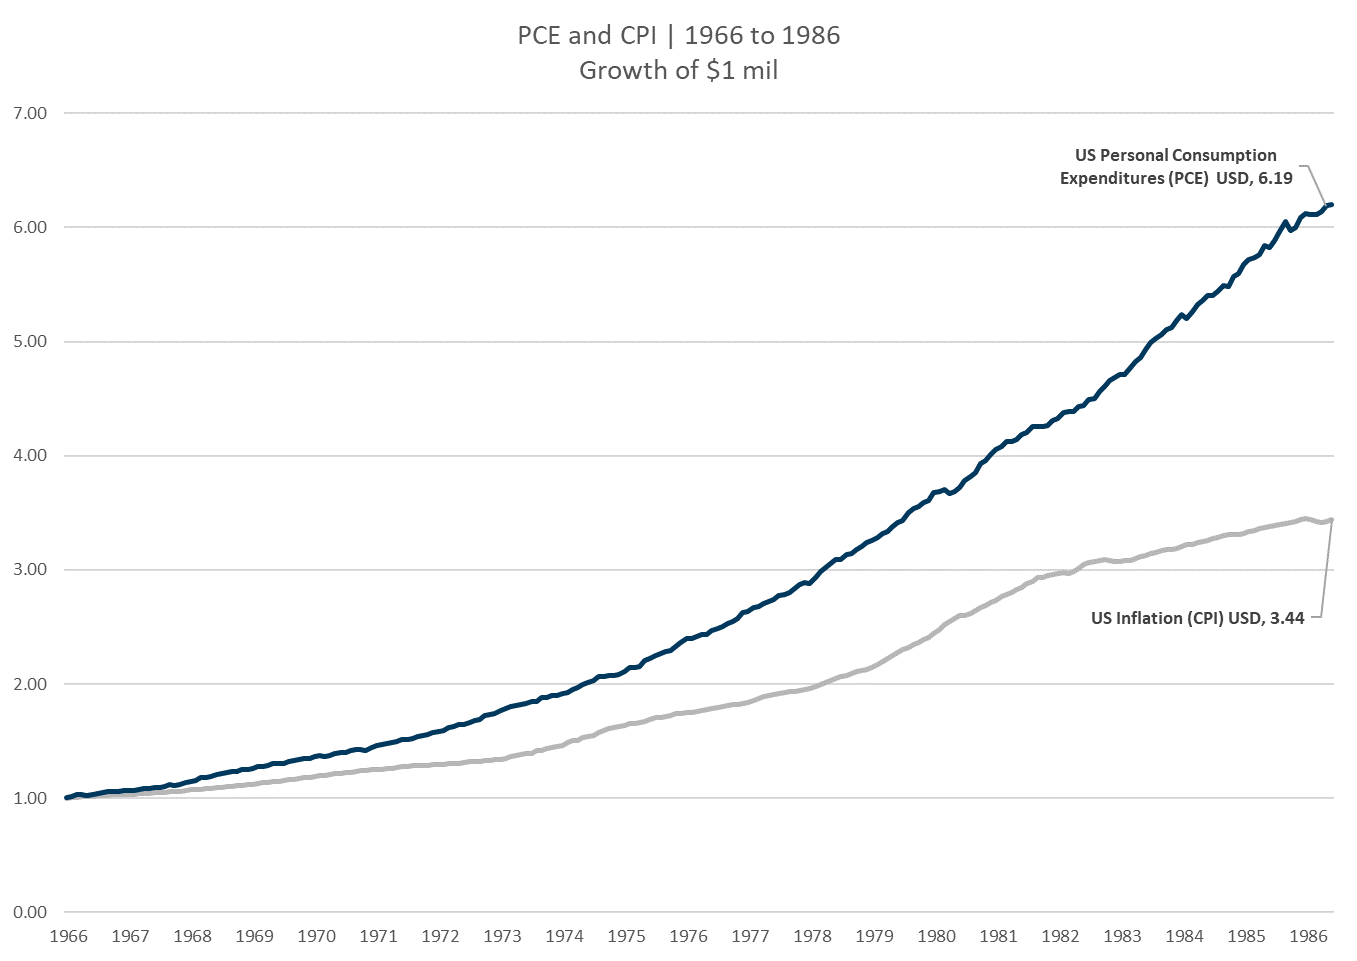
$1 million will grow to $6.19 and $3.44 million respectively at that growth rate.
The only problem is that this is not your wealth that is growth but your consumption.
Assessing the Performance of Equity From 1966 to 1986.
Now, if you wish to preserve the purchasing power of your wealth, would equities be good?
To do that, I decide to measure the performance of some equity indexes against the CPI and PCE over 1966 to 1986. I decide to use a few indexes where I had available data during this period.
Some of these indexes are Dimensional Reference Index. At Providend, we make use of Dimensional funds to plan for their accumulation and retirement income goals.
These reference indexes represented back-tested index performance as if we invest in a specific strategy back then.
With these indexes, an investor can hypothetically gain exposure to capture the performances of these equity strategies by investing in low-cost funds.
I have decided to cover as much as I can so that you can see the performance not just from one angle.
- Dimensional UK Low Market Cap Index – An index of small-cap United Kingdom companies.
- Dimensional UK Large Value Index – An index of large-cap, value United Kingdom companies whose relative price is in the bottom 30%.
- Dimensional UK Marketwide Value Index – an index of United Kingdom companies that are at the bottom 33%. The index emphasizes companies with smaller capitalization, lower relative price, and higher profitability, excluding those with the lowest profitability within their countries’ small-cap universe. The index also excludes companies with the highest asset growth (which is shown to not do too well.)
- Dimensional UK Small Cap Index – An index of small-cap United Kingdom companies, excluding the lowest profitability and highest relative price within the UK small-cap universe.
- Dimensional UK Small Value Index – Index of small-cap, value United Kingdom companies, excluding the lowest profitable and highest asset growth companies.
- Dimensional US Small Cap Value Index – Index of small-cap, value United States companies
- Dimensional US Marketwide Value Index – Index of large-cap stocks that are at the bottom 20-33% of the US market
- Dimensional US Large Cap Index – Index of the largest US companies by market capitalization.
- Dimensional US Large Cap Value Index – Index of companies with a market capitalization above the 1000th largest company, whose relative price is in the bottom 30% of the large companies.
- S&P 500 – Some of the biggest companies in the United States
We have a mixture of US and UK indexes. We have both large-cap and small-cap indexes. We throw in value indexes. For some reason, I could not find growth indexes for that time period.
First, we compare the UK indexes against the US CPI and PCE.
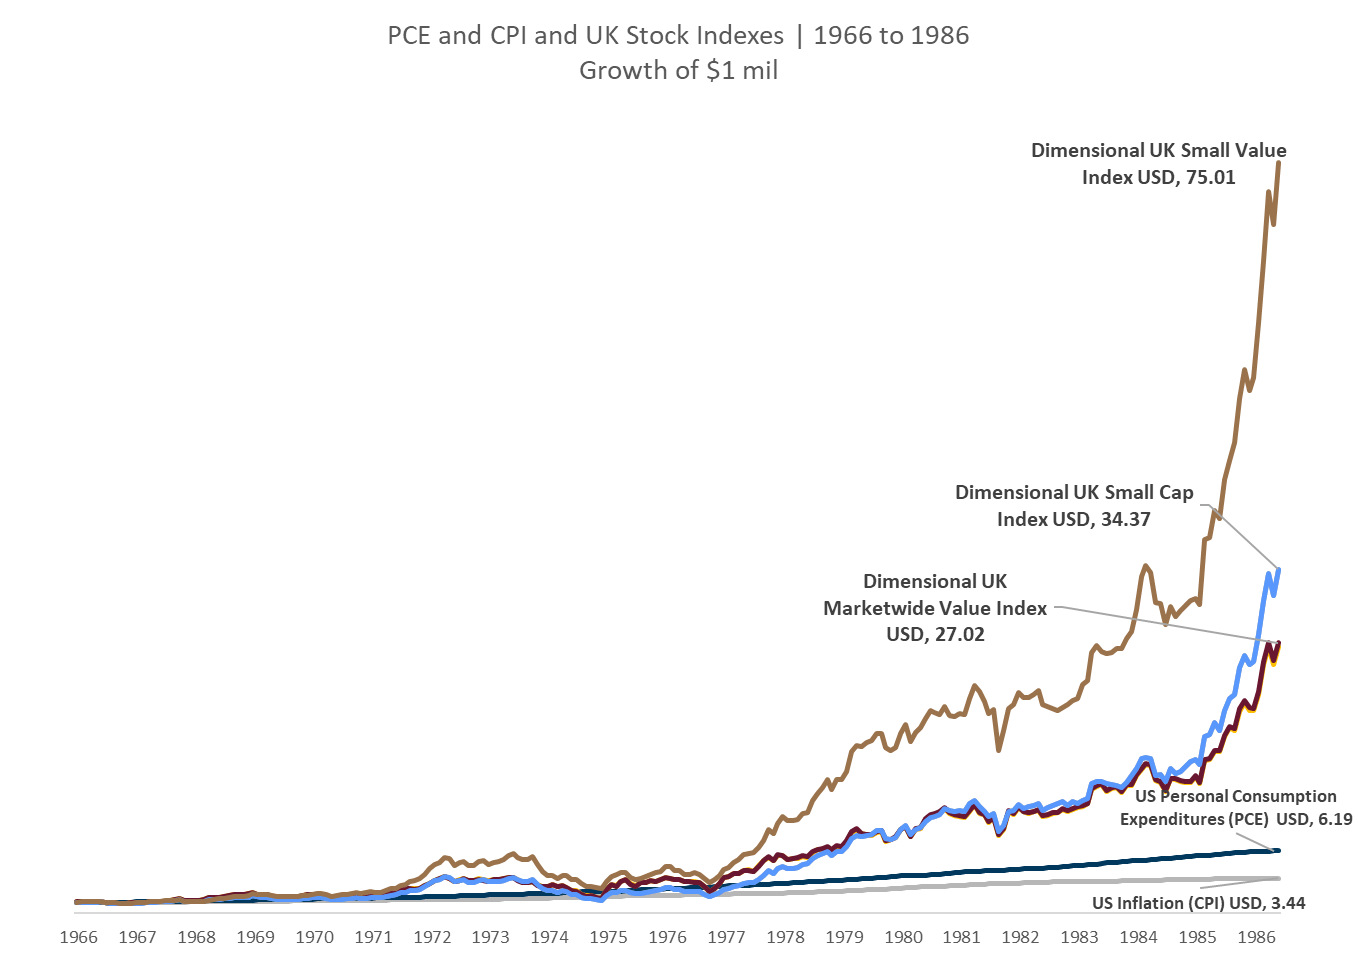
It is a shame that I could not find the UK CPI data for that period. However, it looks like the majority of the UK equity indexes handily beat the PCE and CPI very well. There were a few overlaps in the chart above such that you cannot see two of the indexes.
It seems that whether it is large-cap or small-cap, value indexes did well. In particular, the UK small-cap index can grow $1 million to $75 million!
Let us take a look at the US indexes against the CPI and PCE:
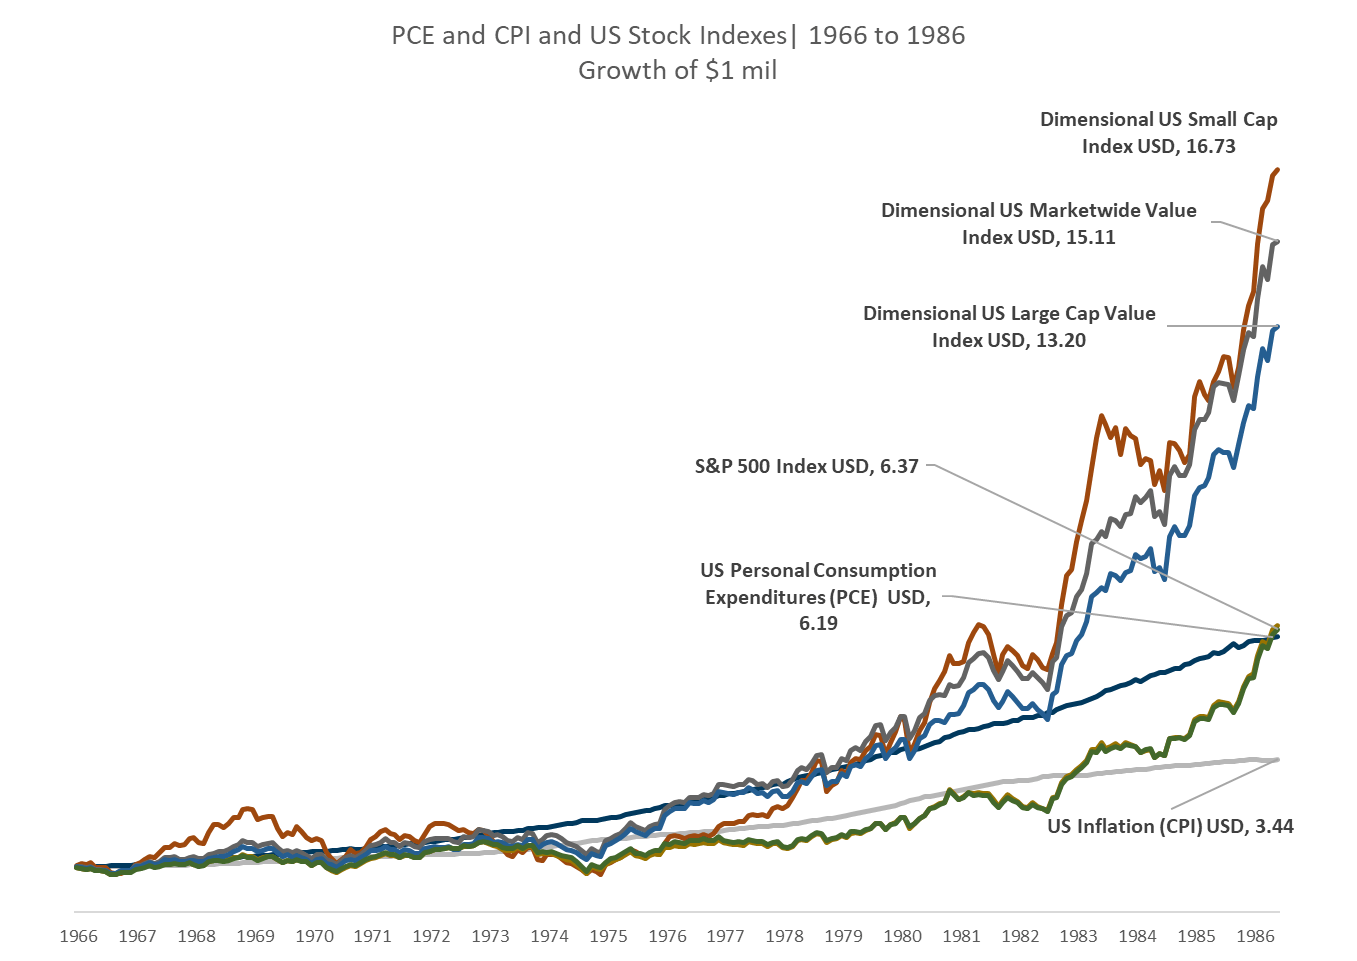
Here are some interesting observations:
- The S&P 500, which are the biggest stocks in the United States was able to beat the CPI but just manage to catch up with the PCE. This is not bad in that while the index struggled it was able to keep up with inflation just not all the cost
- The Dimensional US Large Cap Value did very well, even though it is based on the largest stocks. The value tilt in that period really helped.
- However, if you tilt towards small-cap, you did outstanding
Relatively speaking equities have done well in a high inflation environment.
How Well did the Large Cap Stock Indexes Around the World Do During Period of High Inflation?
MSCI only started tracking major country indexes in 1970. While we missed out on some years, this is still a period of rather high inflation.
Here is the inflation from 1970 to 1986:
Now let us compare the compounded average growth of some major geographical regions during these 17 years:
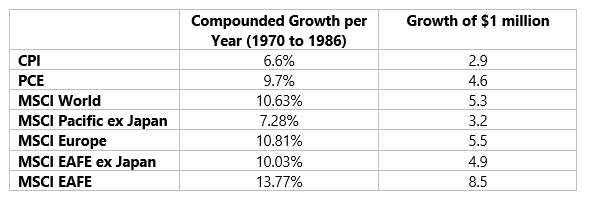
Remarkably, only MSCI Pacific ex-Japan failed to keep up with the PCE. The other region did very well.
Here is the comparison for a few selected individual countries:
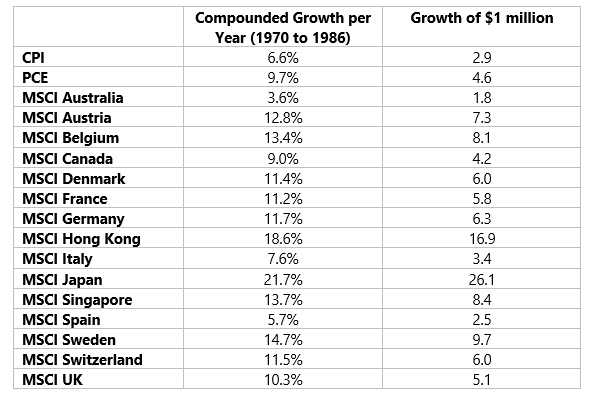
During this period, certain country indexes, such as Australia, Canada, Spain, Italy failed to keep up with the US. personal consumption expenditure.
However, most of the large-capitalization stocks in the countries were able to keep up with inflation based on CPI.
I think what is also significant is that at times you may be concerned that we only show certain strong indexes (such as the S&P 500) just because we have more data. You may question if this observation is pervasive.
If we look at history, it shows that equities’ ability to keep up with inflation or do better is pervasive across different countries.
How did German Equities Perform During their Hyperinflation Crisis?
Perhaps one of the most vivid case studies of high inflation was found in Germany during the Weimar Republic years.
After the first world war, in which Germany lost, the value of their currency, the Mark steadily went down. This was due to a number of factors, but the big one was the flight of German capital abroad, obstacles to the revival of German foreign trade, and the balance of payment problems.
To alleviate budgetary deficit, the government continues a pre-war practise of issuing more money to meet its expenses.
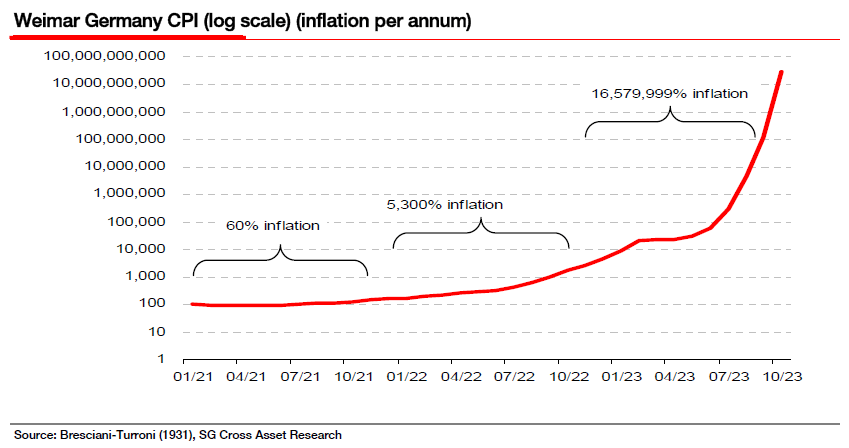
Source: Seeking Alpha
Inflation ran away in a very big way.
What was not discussed a lot was how did stocks in Germany perform.
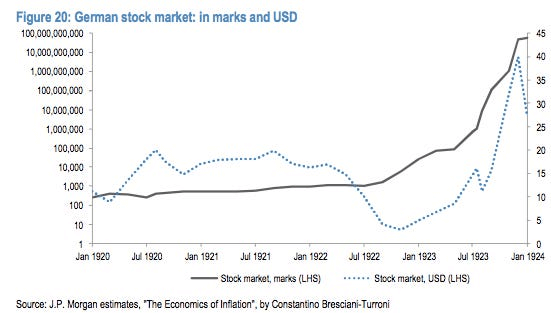
JP Morgan’s European team in 2010 published a big report on how various assets perform during hyperinflationary periods.
Source: Business Insider
The interesting thing noted in the report was that during that period, the German population decide to speculate in stocks.
From the chart above by JP Morgan, the stock market in Marks and USD went up in an exponential manner. You can see the magnitude of the rise is pretty similar to the previous chart, which shows the German CPI during that period.
The population was evading taxation and devoting their money to speculative purchases. Stocks that were yielding 20% in dividend was pushed higher until the prevailing dividend yield was 1%.
Conclusion
History has taught us that sometimes what happens in the future may rhyme with what happens in the past. They are seldom exactly similar.
History also showed us new things that have never happened before may happen.
This presents a challenge for wealth builders seeking a true north how they could position their wealth so that they can take advantage and have less downside.
I hope that in this article you may be able to draw some observations:
- Equities keep up with inflation quite well
- This is shown in different regions
- This is shown in different countries
- The historical study does show that if equities are tilted towards the value and small dimensions (like the Dimensional funds that you may hold), their performance during high inflation periods are better
- The historical study also shows that having growth stocks tend to do poorer during periods like this
#4 and #5 was also observed by financial theorist William Bernstein and Ritholtz Wealth Management’s Ben Carlson (who writes the delightful blog A Wealth of Common Sense. If you invest based on our philosophy, I encourage you to read it.)
In why value died, Ben explained that the data does show that at a low rate, low inflation world, growth rate tends to perform better than value stocks. However, in a higher inflation period, the value premium does show up. Ben also observed that foreign stocks tend to do better than US stocks during periods of higher inflation.
With all that said, we do think it is risky for wealth builders to structure their portfolio based on guessing a particular economic regime happening. It is hard to tell when that will happen, the magnitude of the inflation, how long the said situation will last.
If that scenario does not work out, you may incur opportunity costs but also expose yourself to other risks that you are also concerned about.
The solution to this problem (high inflation) is poor for another potential concern you may have (sleeping well at night, thinking too much about losing money)
We cannot ignore that other asset classes can be rather useful too:
- Your residential and investment property may hold its value well during the higher inflation period
- Bonds will lose purchasing power, but they provide stability. If you need the money for a near term goal, it makes more sense to have enough (but not excessive) to fulfil the life goal.
The more appropriate way to tackle this problem is to take into consideration your unique situation, set up a wealth management plan that allows you to capture the returns, keep up with inflation, and maintain enough liquidity to match your near-term life goals.
Let us know if you need some help.
The article you have just read is part of Providend Curated Insights, a selected repository of content that we research about and reflect upon for the best recommendations to our clients.
Providend Curated Insights is narrated currently by Kyith Ng, Senior Solutions Specialist at Providend, Singapore’s First Fee-only Wealth Advisory Firm, and Chief Editor of InvestmentMoats, Singapore’s most well-read financial blog.
For more related resources, check out:
1. How to Get Passive Income From Your Unit Trust (That Does Not Have a Payout)?
2. A Look through History – Returns of a portfolio of World Equities through Good times and Bad times
3. Stay Invested for The Long Term? Think Again!
We do not charge a fee at the first consultation meeting. If you would like an honest second opinion on your current investment portfolio, financial and/or retirement plan, make an appointment with us today.